
Translate this page into:
Retinal image quality assessment in diabetic-retinopathy screening: Real world evidence from a lower-middle income country


-
Received: ,
Accepted: ,
How to cite this article: Piyasena MP, Hewage SN, Banduthilake K. Retinal image quality assessment in diabetic-retinopathy screening: Real world evidence from a lower-middle income country. Lat Am J Ophthalmol. 2024;7:8. doi: 10.25259/LAJO_24_2023
Abstract
Objectives:
Sight loss due to diabetic retinopathy (DR) is preventable by early detection and treatment. Digital retinal imaging is the most widely practiced method of screening of DR. Poor quality of images is a major hinder to implement systematic DR screening using digital retinal imaging in low- and middle-income countries with a high prevalence of lens opacities. We aimed to identify the proportion of ungradable images using hand-held retinal imaging and predictors of image gradability in a DR screening feasibility study conducted in Sri Lanka.
Material and Methods:
The present study is a retrospective data analysis of a validation study conducted to assess the diagnostic test accuracy of a held-held digital retinal imaging model integrated into a tertiary level medical clinic. Two selected physician graders underwent formal training to assess retinal image quality using a “four-quadrant method of assessing gradability.” The procedure was a subjective image quality assessment performed by the physician graders manually, that is, images with more than 50% of the field with poor clarity and not suitable for retinopathy grading were classified as ungradable. Two-field (Field-1: macula centered, Field-2: disc centered) non-mydriatic and mydriatic retinal images were captured (Type of camera: Zeiss-Visuscout 100®, Germany) in a consecutive sample of people with diabetes attended for routine medical care and assessed for quality and graded by two independent physician graders on-site. The reference test was a mydriatic biomicroscopic examination conducted at a separate eye clinic by an experienced specialist retinologist. Mixed model regression analysis was conducted to assess the predictors of gradability.
Results:
A total of 700 individuals (5508 gradability data points) were included in the study. The proportion of ungradable images in non-mydriatic imaging was 30% for Grader 1 and 24% for Grader 2 and went down to 7% and 5%, respectively, for Grader 1 and 2 after dilating the pupils using mydriatic agents. Non-mydriatic images had almost 20 times higher odds (odds ratio [OR] 19.7, 95% confidence interval [CI] 15.1–25.8) of being rated as ungradable compared to mydriatic images. With the increase of each year in age, the odds of having ungradable digital retinal images in a patient increased by 7% (OR 1.07, 95% CI 1.05–1.09). For visual acuity increase in each level of the Log-MAR scale, the odds of having ungradable images increased by 40% (OR 1.40, 95% CI 1.30–1.51). In lens opacity, 54% higher odds of ungradability were observed when present nuclear opalescence (OR 1.54, 95% CI 1.39–1.70) and posterior subcapsular opacity (OR 1.54, 95% CI 1.24–1.92).
Conclusion:
Non-mydriatic methods may not be suitable as a primary DR screening strategy in countries with a high prevalence of cataracts. Increasing age, poor visual acuity, and the presence of lens opacity are factors that would affect image quality. The capacity to deliver services for managing cataracts may be an important determinant in achieving effective coverage of digital surveillance of DR in low- and middle-income countries.
Keywords
Diabetes
Diabetic retinopathy
Digital retinal imaging
Screening
Gradability
Image quality
Lens opacity

INTRODUCTION
Diabetic retinopathy (DR) is a common microvascular complication of diabetes mellitus (DM), which imposes a significant impact on eye health systems globally.[1] The burden of sight loss due to DR has increased globally, and it is the 5th most common cause of blindness and moderate-to severe visual impairment globally.[2] It is apparent that with the escalating number of people with DM, especially in lowand middle-income countries (LMIC), attention toward DR screening has broadened. Most of the LMIC governments are striving for controlling sight loss due to DR and also to achieve the goals of Universal Eye Health Coverage mitigating inequity.[3] There is a strong body of evidence showing that early screening and treatment for DR would reduce the progression to vision-threatening DR.[4-6] One major requirement to establish systematic DR screening is the availability of effective technology to screen for DR, such as digital retinal imaging.
The early detection of DR depends on the ability of the screening modality to capture retinal signs accurately. The gold standard for DR screening is considered to be the Early Treatment of Diabetic Retinopathy Study mydriatic seven-field stereoscopic retinal imaging using table-top digital imaging systems.[7] However, this method is a complex system to adopt in a resource poor setting. On the other hand, mydriatic slit-lamp biomicroscopic examination by an ophthalmologist is practically not feasible in a resource-scarce setting as a screening strategy.[8] Therefore, these countries are rapidly adopting more innovative and cost-effective digital retinal imaging strategies, such as hand-held digital imaging. One important factor in achieving the required level of diagnostic accuracy is the gradability or quality of digital retinal images. There are gaps in the evidence base in reporting the results of ungradable images, as shown in a systematic review and meta-analysis conducted by the first author of this study.[9]
A sophisticated table-top digital imaging system incurs high capital investment.[10] The hand-held retinal digital retinal cameras are less expensive, easy to move, require minimum space and minimum power consumption, and are user friendly.[11] However, one major drawback of hand-held retinal devices is poor image quality compared to table-top digital cameras.[12,13] Different models of hand-held digital retinal imaging devices have been developed in many parts of the world, yet none of the country programs recommend using hand-held devices in a national DR screening program. One of the main reasons for this is the poor quality of images captured using hand-held devices, along with the limited field-of-view. Therefore, knowing the factors that would affect image quality using hand-held retinal cameras is a requirement when planning DR screening programs, especially in LMICs.
Poor quality of images has been reported as a factor affecting diagnostic test accuracy of detecting retinal biomarkers.[14,15] The Effectiveness of a DR screening modality will depend on the level of accuracy to identify early retinal signs among asymptomatic people with DR. The present study is a substudy of a wider feasibility study to develop a national level DR screening program using hand-held digital retinal imaging in Sri Lanka. We aimed to identify the proportion of ungradable images in this screening model and predictors of image gradability in a substudy of validation of the proposed screening model in the local context.
MATERIAL AND METHODS
We conducted a larger project in the Western Province of Sri Lanka to develop a national DR screening program, aiming to integrate DR screening services into public sector medical clinics.[16] The present study is based on a retrospective analysis of data captured in the feasibility study of this project aimed at assessing the diagnostic test accuracy of staging DR from digital retinal images by physician graders. Details of that study and its results have been previously published elsewhere.[17,18]
Ethics approval for the project was obtained from the Ethics Review Committee of the National Eye Hospital of Sri Lanka (Ref: ERC/NEH/2017/32, March 10, 2017) and the London School of Hygiene and Tropical Medicine United Kingdom (Ref: 12072, May 19, 2017). We followed ethics guidelines declared in the Helsinki Declaration of 1975 as revised in 2000.
Study design
In the validation study, eyes of a consecutive sample of people with DM (PwDM) (n = 700) presented for routine follow-up for diabetes at a tertiary level medical clinic were imaged using a hand-held digital retinal camera (Zeiss Visuscout-100®, Jena, Germany). From each eye, two-field retinal images (field 1-macula centered, field 2-disc centered) were obtained, one with the natural state of the pupil (nonmydriatic), and the second following pharmacologically dilating the pupil (mydriatic). These retinal images were assessed for quality and graded by two independent graders on-site who were the physicians treat PwDM, following a special training on image-based retinopathy grading in the feasibility study.[17] Full details of the training program are published elsewhere.[19] The physician graders underwent a formal training to assess the image quality in each field using a “four-quadrant method of assessing gradability,” as illustrated in [Figures 1-4]. The procedure was a subjective image quality assessment performed by the physician graders manually. Images with more than 50% of the field with poor clarity (i.e., two-quadrants – Figure 2b) and not suitable for retinopathy grading were classified as ungradable [Figure 5], while the remaining images were considered as gradable and graded for the level of retinopathy accordingly. Figures 1-4 – Steps of assessing the gradability of images using “4-quadrants approach” (Based on four retinal fields of interest).
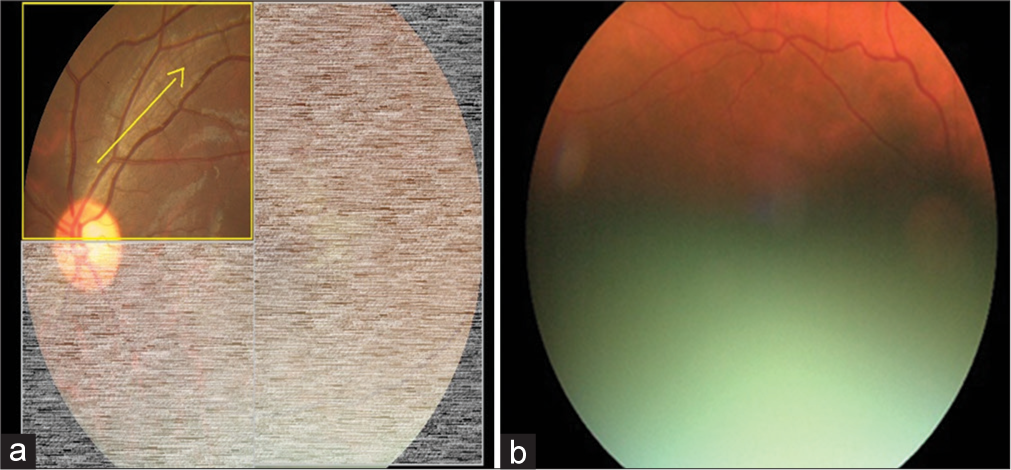
- Step 1: Trace through the superior nasal vessels and superior temporal vessels arcade for visibility of vessels as a measure of image quality (Yellow arrow depicts the suggested direction of tracing vessels on a retinal image). (a) Schematic diagram for 25% gradability classification, (b) Actual image of 25% gradable.
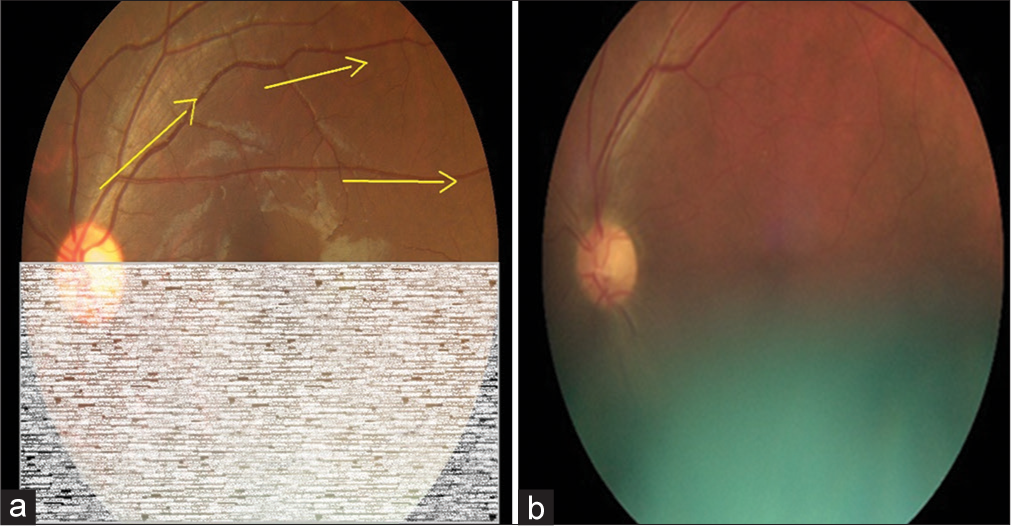
- Step 2: Continue tracing through the superior temporal vessels arcade for visibility of vessels as a measure of image quality (Yellow arrows depict the suggested direction of tracing vessels on a retinal image). (a) Schematic diagram for 50% gradability classification, (b) Actual image of 50% gradable.
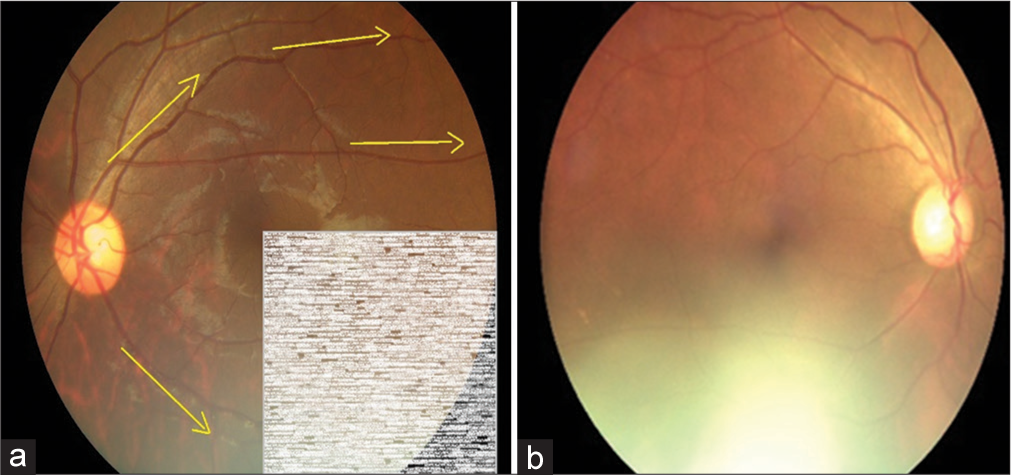
- Step 3: Trace through the inferior nasal vessels and inferior temporal vessels for visibility of vessels as a measure of image quality (Yellow arrows depict the suggested direction of tracing vessels on a retinal image). (a) Schematic diagram for 75% gradability classification, (b) Actual image of 75% gradable.
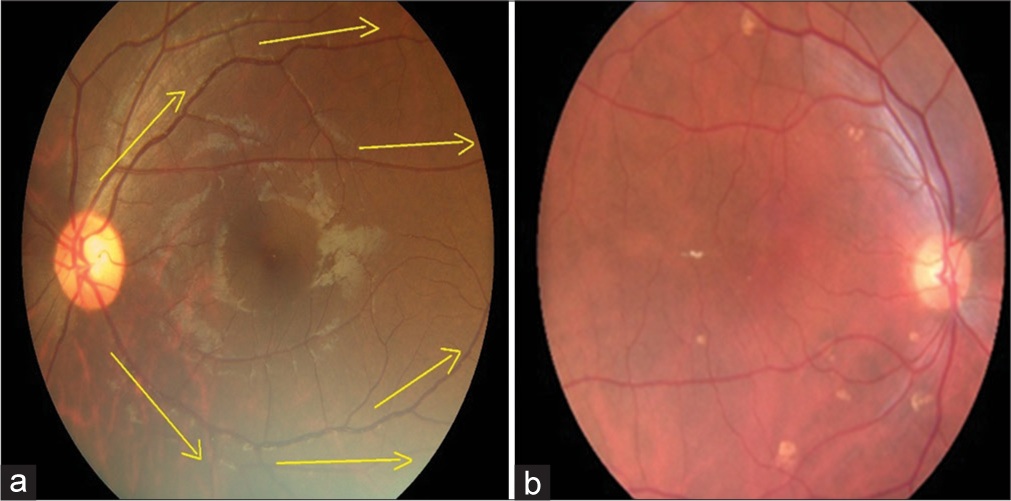
- Step 4: Continue tracing through the inferior temporal vessels arcade for visibility of vessels as a measure of image quality (Yellow arrows depict the suggested direction of tracing vessels on a retinal image). (a) Schematic diagram for 100% gradability classification, (b) Actual image of 100% gradable.
- Ungradable Image (Retinal fields 100% not visible).
In the feasibility study, the diagnostic test accuracy of retinal image-based grading for DR was compared to the local reference standard of grading done by a specialist retinologist using slit-lamp biomicroscopy. The examination by the specialist retinologist consisted of findings related to other structures of the eye, that is, reporting on pathologies of the cornea, lens, and vitreous that may impact visualization of the retina.
Statistical analysis plan
The binary logistic regression was considered as the most appropriate analytical method for identifying the predictors of digital retinal image gradability. In mixed modeling, a multitude of variables were considered as fixed effect predictors when fitting the model. These include factors at the level of the participant and factors at the level of the eye. Participant-level predictors taken into consideration were as follows: (1) sex: categorical variable with levels being male and female; (2) age: continuous variable measured in years; (3) ethnicity: categorical variable with levels being Sinhala, Tamil, Muslim, and other; and (4) duration of diabetes: continuous variable measured in years.
Fixed effect predictors considered at the level of each eye were mainly based on findings of the specialist retinologist’s examination. The fixed effect predictors at the level of the eye were as follows: (1) Pupillary status: non-mydriatic and mydriatic; (2) visual acuity: Log-MAR ranging from 0.00 to no perception of light; (3) pupil diameter: measured in millimeters; (4) status of lens: natural lens (phakic) and artificial lens (pseudophakic); (5) level of nuclear opalescence: no nuclear opacity to mature cataract [NO 1–NO 6]; (6) level of posterior subcapsular opacity: no posterior subcapsular opacity to opacity level of P5 [P1–P5]; (7) cortical cataract: no cortical cataract to cataract level of C5 [C1–C5]; (8) posterior polar cataract: present and absent; and (9) posterior capsular opacity: present and absent [PCO+/−]. The status of the lens was classified using standards defined in Lens Opacities Classification System Version III.
Initially, the potential fixed effect predictors were individually screened for statistical significance, controlling only for the random effects. The factors that were significant (P < 0.05) were included in the mixed model analysis, and the final fitted model was arrived at by the backward elimination method that sequentially removed non-significant variables.
RESULTS
A total of 700 individuals were included in the study. The rate of ungradability showed a marked reduction from non-mydriatic to mydriatic retinal images for both the graders, where in one, it went down from almost 30% to 7%, while in the other, it was from close to 24% down to almost 5% [Table 1].
| Pupillary Status | Grader | Gradable Count (%) | Ungradable Count (%) |
|---|---|---|---|
| Non-mydriatic | Grader 1 | 979 (70.5) | 410 (29.5) |
| Grader 2 | 1058 (76.2) | 330 (23.8) | |
| Mydriatic | Grader 1 | 1282 (93.0) | 96 (7.0) |
| Grader 2 | 1309 (95.1) | 68 (4.9) |
When analyzing the level of agreement gradability between the two graders, it showed that the percentage agreement (the percentage of images that both graders classified as gradable or ungradable) was 86.7% in the non-mydriatic ones compared to 96.9% for mydriatic ones. The agreement measured by the Kappa statistic (k) also showed a similar pattern with values of 0.66 and 0.73, respectively [Table 2].
| Grader 2 | Kappa Agreement (95% CI) | ||||
|---|---|---|---|---|---|
| Gradable (%) | Ungradable (%) | Total (%) | |||
| Non-mydriatic Imaging | |||||
| Grader 1 | |||||
| Gradable | 926 (66.8) | 53 (3.8) | 979 (70.6) | ||
| Ungradable | 132 (9.5) | 276 (19.9) | 408 (29.4) | k=0.66 | |
| Total | 1058 (76.3) | 329 (23.7) | 1387 (100.0) | (0.61–0.70) | |
| Mydriatic Imaging | |||||
| Grader 1 | |||||
| Gradable | 1274 (92.5) | 7 (0.5) | 1281 (93.0) | ||
| Ungradable | 35 (2.5) | 61 (4.4) | 96 (7.0) | k=0.73 | |
| Total | 1309 (95.1) | 68 (4.9) | 1377 (100.0) | (0.65–0.81) | |
CI: Confidence interval
In the process of assessing predictors of gradability, each individual gradability measure from each grader was taken as separate observations. The dataset thus created had 5508 data points after stacking the original observations by the side of the eye, pupillary status when imaged, and grading by each grader. In addition to cases that had to be removed due to missing gradability findings and specific statistical modeling convenience, there were ten participants that had failed to undergo the assessment by the retinologist. This ultimately resulted in 44 data points with missing observations on lens characteristics etc. Even though such cases were not removed before analysis, they were excluded in the individual modeing steps that required these variables.
When individually screening the contender variables using the logistic mixed model, nine variables became significant. These were as follows: pupillary status of an eye when imaged, age, ethnicity, duration of diabetes, visual acuity of an eye, lens type in the eye, level of nuclear opalescence of lens, posterior subcapsular opacity of lens, and posterior capsular opacity of lens. When arriving at the final model, it was fitted with these variables and four became non-significant, and were removed.
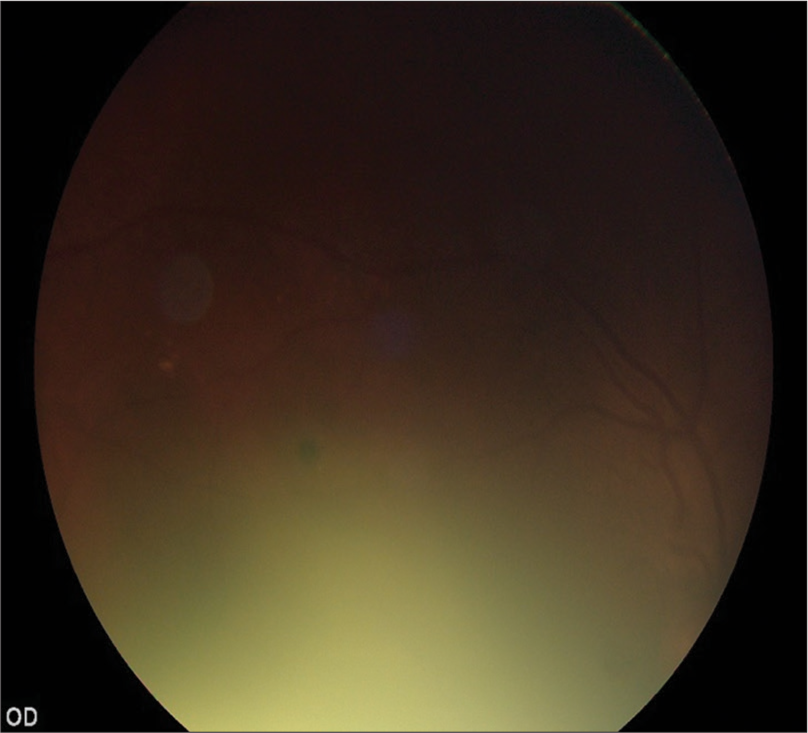
According to the final model the independent predictors that determine if a digital retinal image of a person with diabetes is rated as gradable or not are whether the image was taken with a pharmacologically dilated pupil or not, the age of the person, visual acuity of the eye, level of nuclear opalescence of the lens of the eye, and level of posterior subcapsular opacity of lens. Non-mydriatic images had almost 20 times higher odds (odds ratio [OR] 19.7, 95% confidence interval [CI] 15.1–25.8) of being rated as ungradable compared to mydriatic images after adjusting for effects of all other variables in the model. With the increase of each year in age, the odds of having ungradable digital retinal images in a patient increased by 7% (OR 1.07, 95% CI 1.05–1.09). After adjusting for all other factors, worse visual acuity itself was found to be related to the ungradability of retinal images in the eyes of people with diabetes. For an increase in each level of the Log-MAR scale, the odds of having ungradable images increased by 40% (OR 1.40, 95% CI 1.30–1.51). For the lens opacity related factors, both of nuclear opalescence and posterior sub-capsular opalescence had a similar amount of impact on ungradability of digital retinal images [Figure 6]. Along both these scales of opalescence, the odds of ungradability climbed by 54% [Table 3].
- Fundus image of a patient with lens opacity.
| Predictor variable | Significance (P) | OR | OR 95% CI | |
|---|---|---|---|---|
| Lower | Upper | |||
| Pupillary status (compared to mydriatic) Non-mydriatic |
<0.001 | 19.72 | 15.09 | 25.77 |
| Age | <0.001 | 1.07 | 1.05 | 1.09 |
| Log-MAR visual acuity | <0.001 | 1.40 | 1.30 | 1.51 |
| Nuclear opalescence cataract level | <0.001 | 1.54 | 1.39 | 1.70 |
| Posterior sub capsular cataract level | <0.001 | 1.54 | 1.24 | 1.92 |
OR: Odds ratio, CI: Confidence interval
Missing data
The number of eyes, the number of retinal images, and the number of grading results were lower than the expected count due to multiple reasons as mentioned below; one eviscerated eye, three phthisical eyes, two individuals either failed to be imaged, or all images of their eyes had gone missing in the process of saving or transference for grading, one non-mydriatic images of both eyes were unavailable for grading, and further, seven individuals failed to be imaged in the mydriatic status. In grading results, one grading result for a non-mydriatic image of an eye was missing in one of the graders. For the second grader, three grading results were missing: non-mydriatic image grading of two eyes (of the same person) and a mydriatic image grading of an eye.
DISCUSSION
We identified that status of pupil, increase in age, poor visual acuity and lens opacity are the major predictors of retinal image gradability in an LMIC setting, where major cause of blindness is cataract. Implementing a new DR screening modality using digital retinal imaging will depend on many contextual factors.[20] The quality of images captured in a digital retinal surveillance system is affected at three levels in the imaging and grading process, that is, when capturing the image, image processing system, and display. Most of these factors are modifiable based on service provider requirements except the patient factors at image capturing stage. Therefore, the successful implementation of a population-based screening program may depend on the factors such as the prevalence of cataracts among PwDM. A meta-analysis on assessing diagnostic test accuracy of DR screening digital retinal imaging reported a mean proportion of ungradable images in non-mydriatic imaging as 18.4% (95% CI 13.6–23.3%) and mydriatic imaging as s 6.2% (95% CI 1.70–10.8%) which is compatible with our findings in the present study.[9] A study conducted in India also reported 30.6% of ungradable images when using nonmydriatic imaging.[21] Even in studies conducted in high-income countries reported that central cataract is a cause for poor image quality.[13] These studies underscore our study finding. Therefore, our main message is that non-mydriatic imaging strategies may not be successful in LMIC DR screening programs, especially when using hand-held retinal imaging.
High population coverage with gradable images (<5% poor quality) is a pragmatic consideration to achieve the desired level of diagnostic test accuracy in a DR screening program. The Scottish National DR Screening Program uses nonmydriatic digital retinal imaging as its primary screening strategy. There is a tendency to recommend non-mydriatic imaging in any country’s income setting, considering the convenience for the service provider as well as the service user. However, an adaptation of such a non-mydriatic imaging modality in an LMIC depends on local contextual factors such as the prevalence of cataracts and corneal diseases. In our study, we learned that non-mydriatic imaging may not be recommended without assessing image gradability in a real-world sample of PwDM representing the population of concern.
On the other hand, there are gaps in the evidence base regarding the gradability of images in DR screening using digital retinal imaging due to selective reporting, whether it is hand-held or table-top imaging systems. Our previous systematic review and meta-analysis showed that 13 studies had excluded ungradable images in their data analyses, which highlights the requirement of transparent reporting in DR screening using digital retinal imaging. In addition, in the same systematic review, we noted that accuracy data was not adjusted for ungradable proportion of images, that may have led to inflated diagnostic test accuracy results.[9] One key factor in evaluating the accuracy of a hand-held retinal imaging device in a DR screening program is a method of diagnostic test accuracy calculation, that is, whether ungradable images are included or excluded from the analysis. The rapid expansion of DR screening assisted with artificial intelligence underscores the requirement of producing good quality retinal images in DR screening programs.
The quality of the retinal images is affected at four stages: the technical capacity of the camera, the characteristics of the eye when capturing the image, the skills of the photographer, and the quality of the image viewing device. In our feasibility study, we could not achieve the recommended level of technical failure rate (<5%) due to poor image quality.[18] Image quality also varies with the viewing monitor. Due to the reduced number of pixels, the image quality of a hand-held camera goes down. A study conducted in India reported that 89.4% of images were gradable; however, they viewed the images directly on the display on a hand-held device.[22] Another study in India reported 30–31% ungradable which is comparable with our study.[21] Central lens opacities have been reported as a cause of poor image quality, even in high-income countries.[13] Another study conducted in a high-income country stated that the retinal field of interest, the interphotograph interval, age, and ethnic group of the participants are stronger predictors of the quality of nonmydriatic retinal images, underscoring our finding.[23]
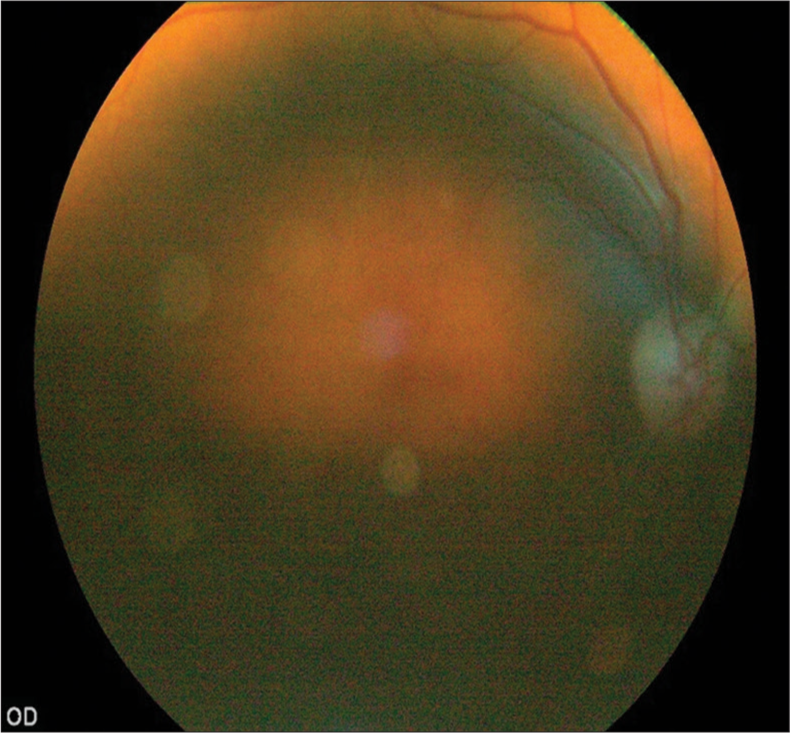
One main disadvantage of hand-held cameras is their difficulty in controlling unavoidable movements that affect image quality. We noticed that the unrestricted maneuverability made them easier to use, especially when a patient has difficulty in bending their neck to stabilize on a chin-rest. In our study, the interphotograph interval was very low, as there was a steady flow of PwDM in a busy medical clinic, which could be another reason for a high proportion of poor quality images. In addition, there were technical factors that could affect the sharpness of the images. The main one was the photographer’s handshake that led to blurred images, that is, motion blurring, defocusing, and edge diffusion.[24] Most participants in our study presented with a pupil size of 2–3 mm, where it led to difficulties in capturing images without dilating the pupils. Similar observations were made in a study conducted in Andhra Pradesh, India, where they reported a 34% rate of ungradability due to small pupils.[25] In our study, we found a higher proportion of ungradable images among the pseudophakics. When we explored this, we identified that physician graders had captured images in manual mode without adjusting for the respective refractive indices of the participants, which are adjustable from +20D to −20D [Figure 7]. A review conducted by Cuadros and Bresnick concluded that hand-held retinal cameras are convenient to use but do not provide sufficient image quality[26] highlighting some concerns in promoting hand-held devices in DR screening.
- Fundus image of a pseudophakic patient.
Strengths and limitations
We used a real-world consecutive sample of patients at a public sector diabetic clinic in this study. One limitation in our model is we did not consider external factors such as motion blurring, defocusing and edge diffusion which also could lead to poor image quality but has no bearing on patient related variables that we assumed. We noted that image quality had reduced when capturing retinal images among pseudophakics when graders did not adjust the camera matching with the refractive indices of the participant. This mostly happens when capturing images using manual mode, which auto-focusing mode will adjust for refractive indices in a range +20D to −20D automatically. The image quality assessment by human graders is a subjective assessment that can be confounded by various factors such quality of the viewing monitor, ambient lighting, and grader-dependent factors. In addition, we have not recorded the flash intensity of the camera when capturing the images in our study.
CONCLUSION
The proportion of good-quality images captured in a digital surveillance system is an important determinant of implementing systematic DR screening using digital retinal imaging in LMICs. Non-mydriatic methods may not be suitable as a DR screening strategy in LMICs with a high prevalence of cataracts. Using mydriatic agents reduces the failure rates significantly. The evidence generated in the local contexts is prime importance, before investing in DR screening programs. The capacity to deliver services for managing cataracts is also an important determinant in achieving effective coverage of digital surveillance. We recommend more research on the assessment of digital retinal image quality in LMIC settings, informing the development of practice guidelines for image quality assessment embedded within the national DR screening guidelines.
Acknowledgments
The overall main project was funded by the Queen Elizabeth Diamond Jubilee Trust coordinated through the Commonwealth Eye Health Consortium in the United Kingdom. Local administrative and logistical support was provided by the Association of Vitreo-Retina Specialists of Sri Lanka.
Ethical approval
The research/study approved by the Institutional Ethics Review Committee of National Eye Hospital of Sri Lanka (Ref: ERC/NEH/2017/32, March 10, 2017) and London School of Hygiene and Tropical Medicine United Kingdom (Ref:12072, May 19, 2017).
Declaration of patient consent
The authors certify that they have obtained all appropriate patient consent.
Conflicts of interest
There are no conflicts of interest.
Use of artificial intelligence (AI)-assisted technology for manuscript preparation
The authors confirm that there was no use of artificial intelligence (AI)-assisted technology for assisting in the writing or editing of the manuscript and no images were manipulated using AI.
Financial support and sponsorship
The overall main project was funded by the Queen Elizabeth Diamond Jubilee Trust coordinated through the Commonwealth Eye Health Consortium in the United Kingdom.
References
- International diabetes federation diabetes atlas 2022. 2023. Belgium: IDF; Available from: https://diabetesatlas.org/2022-reports [Last accessed on 2023 Aug 15]
- [Google Scholar]
- Global estimates on the number of people blind or visually impaired by diabetic retinopathy: A meta-analysis from 1990 to 2010. Diabetes Care. 2016;39:1643-9.
- [CrossRef] [PubMed] [Google Scholar]
- Diabetic retinopathy in sub-Saharan Africa: Meeting the challenges of an emerging epidemic. BMC Med. 2013;11:157.
- [CrossRef] [PubMed] [Google Scholar]
- Photocoagulation treatment of proliferative diabetic retinopathy. Clinical application of diabetic retinopathy study (DRS) findings. DRS report number 8. Ophthalmology. 1981;88:583-600.
- [CrossRef] [PubMed] [Google Scholar]
- Photocoagulation for diabetic macular edema. ETDRS report no 1. Arh Ophthalmol. 1985;103:1796-806.
- [CrossRef] [PubMed] [Google Scholar]
- Early vitrectomy for severe vitreous hemorrhage in diabetic retinopathy. Two-year results of a randomized trial-diabetic retinopathy vitrectomy study report 2. Arch Ophthalmol. 1985;103:1644-52.
- [CrossRef] [PubMed] [Google Scholar]
- Grading diabetic retinopathy from stereoscopic colour fundus photographs-An extension of the modified Airlie House classification : ETDRS report number 10. Early treatment diabetic retinopathy study group. Ophthalmology. 1991;98:786-806.
- [CrossRef] [PubMed] [Google Scholar]
- The number of ophthalmologists in practice and training worldwide : A growing gap despite more than 200 000 practitioners. Br J Ophthalmol. 2012;96:783-7.
- [CrossRef] [PubMed] [Google Scholar]
- Systematic review and meta-analysis of diagnostic accuracy of detection of any level of diabetic retinopathy using digital retinal imaging. BMC Syst Rev. 2018;7:182.
- [CrossRef] [PubMed] [Google Scholar]
- Cost effectiveness analysis of screening for sight threatening diabetic eye disease. BMJ. 2000;320:1627-31.
- [CrossRef] [PubMed] [Google Scholar]
- Construction of an inexpensive, hand-held fundus camera through modification of a consumer “point-and-shoot” camera. Investig Ophthalmol Vis Sci. 2012;53:7600-7.
- [CrossRef] [PubMed] [Google Scholar]
- Utility of 1% tropicamide in improving the quality of images for tele-screening of diabetic retinopathy in patients with dark Irides. Ophthalmic Epidemiol. 2017;24:217-21.
- [CrossRef] [PubMed] [Google Scholar]
- The influence of age, duration of diabetes, cataract, and pupil size on image quality in digital photographic retinal screening. Diabetes Care. 2005;28:2448-53.
- [CrossRef] [PubMed] [Google Scholar]
- Assessment of image quality on color fundus retinal images using the automatic retinal image analysis. Sci Rep. 2022;12:10455.
- [CrossRef] [PubMed] [Google Scholar]
- Fundus image quality assessment: Survey, challenges and future scope. IET Image Process. 2019;13:1211-24.
- [CrossRef] [Google Scholar]
- A situation analysis and mapping of availability of services for diabetic retinopathy in health care institutions in the Western province-Sri Lanka. Ceylon Med J. 2017;62:205-6.
- [CrossRef] [PubMed] [Google Scholar]
- Development and validation of a diabetic retinopathy screening intervention using a hand-held nonmydriatic digital retinal camera by physician graders at a tertiary level medical clinic: Protocol for a validation study. JMIR Res Protoc. 2018;7:e10900.
- [CrossRef] [PubMed] [Google Scholar]
- Diagnostic test accuracy of diabetic retinopathy screening by physician graders using a hand-held non-mydriatic retinal camera at a tertiary level medical clinic an LMIC. BMC Ophthalmol. 2019;19:89.
- [CrossRef] [PubMed] [Google Scholar]
- Training of physician graders on diabetic retinopathu screening using hand-held digital retinal imaging in a non-ophthalmic setting. Pan Am J Ophthalmol. 2023;5:31-6.
- [CrossRef] [Google Scholar]
- Need for more and better implementation science in global health. BMJ Global Health. 2016;1:e000115.
- [CrossRef] [PubMed] [Google Scholar]
- Sensitivity and specificity of nonmydriatic digital imaging in screening diabetic retinopathy in Indian eyes. Indian J Ophthalmol. 2014;62:851-6.
- [CrossRef] [PubMed] [Google Scholar]
- Diabetic retinopathy screening programme utilising non-mydriatic fundus imaging in slum populations of New Delhi, India. Trop Med Int Health. 2018;23:405-14.
- [CrossRef] [PubMed] [Google Scholar]
- Quality of nonmydriatic digital fundus photography obtained by nurse practitioners in the emergency department : The FOTO-ED study. Ophthalmology. 2012;119:617-24.
- [CrossRef] [PubMed] [Google Scholar]
- A retinal image sharpness metric based on histogram of edge width. J Algorithms Comput Technol. 2017;11:292-300.
- [CrossRef] [Google Scholar]
- Analysis of yield of retinal imaging in a rural diabetes eye care model. Indian J Ophthalmol. 2018;66:233-7.
- [CrossRef] [PubMed] [Google Scholar]
- Can commercially available handheld retinal cameras effectively screen diabetic retinopathy? J Diabetes Sci Technol. 2017;11:135-7.
- [CrossRef] [PubMed] [Google Scholar]


