Translate this page into:
Fractal evaluation in retinographies of patients with diabetic retinopathy with and without risk of macular edema

*Corresponding author: Romildo de Albuquerque Nogueira, Department of Morphology and Animal Physiology, Federal Rural University of Pernambuco, Recife, Brazil. nogrolmido@gmail.com
-
Received: ,
Accepted: ,
How to cite this article: Costa EV, Nogueira RA. Fractal evaluation in retinographies of patients with diabetic retinopathy with and without risk of macular edema. Lat Am J Ophthalmol 2023:6:16.
Abstract
Objectives:
This study aims to evaluate the fractal dimensions (FDs) (box-count dimension and information dimension (Dinf)) and the number of bifurcations (NOB) in retinography of patients with diabetic retinopathy (DR) of grades 2 and 3, both groups without and with risk of diabetic macular edema.
Material and Methods:
Forty-six retinographies of patients with DR were selected, and classified according to the number of microaneurysms, hemorrhages, and the presence of neovascularization: Grade 2 and grade 3. The images were skeletonized, and then the FDs and the NOB were calculated.
Results:
The values of box-counting, Dinf, and the NOB of the retinal vascular networks (whole and in the macular region) did not show statistical differences between the grade 2 groups without and with risk of edema, as well as between the grade 3 groups without and with risk of edema.
Conclusion:
The FD and the NOB revealed that the architecture of the retinal vascular network of individuals with diabetic retinopathy remains unchanged in the presence or absence of risk of macular edema.
Keywords
Fractal dimension
Retinal vascular network
Diabetic retinopathy
Diabetic macular edema
Retinography
INTRODUCTION
Diabetic retinopathy (DR), caused by long-term diabetes mellitus (DM), is involved in severe structural and functional changes in retinal vessels due to hyperglycemia.[1,2] These microvascular alterations can lead to hemorrhages, microaneurysms, formation of hard and soft exudates, characterizing the initial condition of DR known as non-proliferative diabetic retinopathy.[2,3] At this stage, high vascular permeability and capillary occlusions are also observed.[3] The most advanced stage of DR is known as proliferative diabetic retinopathy (PDR). PDR is mainly characterized by the presence of neovascularization, an abnormal growth of new blood vessels in various regions of the retina that can lead to blindness.[2-4]
PDR can lead to diabetic macular edema (DME), which can cause vision loss in diabetic patients.[4] DME can be diffuse or focal. Diffuse DME is caused by disruption of the inner blood-retinal barrier, while focal DME is marked by the presence of hard exudate, ring-shaped surrounding a cluster of microaneurysms.[5] The threat of damage to vision from PDR is more common for patients with type I DM; while vision impairment among patients with type II DM is mainly due to DME.[6]
Even with vascular changes, it may be a curious fact to know whether the architecture of the retinal vascular network of patients with a certain degree of DR would have a different morphological complexity than that of a patient with DR who would probably have DME. Recognizing this vascular complexity could help in the clinical evaluation of this disease, since the retinal vascular network can behave like a fractal structure.[7] Fractals objects or processes were described by Mandelbrot[8] and are characterized by the following properties: (1) Self-similarity, which means that parts of an object or process resemble the whole object or process; (2) scaling, which means that the measured properties depend on the scale at which they are measured; and (3) fractal dimension (FD), which provides a quantitative description of the self-similarity and scaling. Hence, a fractal structure is characterized by self-similarity and scale dependence, that is, the small parts of the fractal structure have similarities with the entire structure.[9] As we can observe the branching of the vascular network occurring at various levels of blood vessel diameter, we can accept the vascular network as a fractal object.[9,10] Therefore, fractal geometry can be used in the evaluation of the retinal vascular network affected by different diseases.[11-14] This study aims to evaluate the FD (box-counting dimension [Dbc] and information dimension [Dinf]) and number of bifurcations (NOB) of retinography of patients with grade 2 DR without and with risk of DME, as well as grade 3 DR without and with risk of DME.
MATERIAL AND METHODS
Retinographies
The experimental study was carried out at the Theoretical, Experimental, and Computational Biophysics Laboratory of the Federal Rural University of Pernambuco (Pernambuco, Brazil), from September 2021 to October 2022. Forty-six retinographies (1440 × 960 pixels) were selected from the MESSIDOR database (messidor.crihan.fr/download-en. php) of patients with DR classified according to the number of microaneurysms, hemorrhages and the presence of neovascularization (angiogenesis): Grade 2 (between 6 and 14 regions with microaneurysms or up to 4 regions with hemorrhages); and grade 3 (from 15 regions with microaneurysms, or from five regions with hemorrhages or presence of neovascularization). DME risk was based on the presence of hard exudate near the macular region. In this case, it was considered that the shortest distance between the macula and hard exudates is less than or equal to a papillary diameter. Thus, the following groups were formed: Grade 2 DR (n = 12), grade 3 DR (n = 11), grade 2 DR with a risk of DME (n = 12), and grade 3 DR with a risk of DME (n = 11). The risk of DME is not present in grade 1 DR.
Skeletonization of the entire retinal vascular network and the macular region
The blood vessels of the retinographies (1440 × 960 pixels) were skeletonized using Microsoft’s Paint (Microsoft Corporation, USA) as described in Costa and Nogueira.[10] Skeletonization is a method that represents the image of the retinal vascular tree, all vessels having a single width, in a binarized way (vessels in white and image background in black). Figure 1 shows how the skeletonized retinography was divided into nine regions of equal area using PhotoScape v.3.7 (Mooii Tech Co., Republic of Korea), in which the central area refers to the macular region.
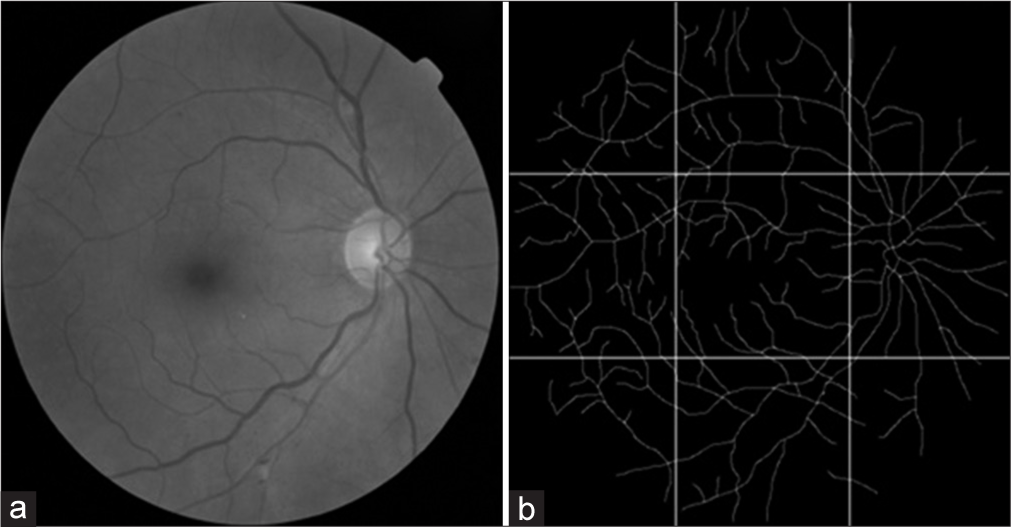
- (a) shows a retinography of an individual with grade 2 diabetic retinopathy. (b) is image a skeletonized and divided into equal areas, in which the central area is the macular region.
FD methods: Dbc and Dinf
FD (Dbc and Dinf) of the images of the skeletal vascular network of the entire retina and of the macular region was performed using the Benoit 1.3 Fractal Analysis System (Trusoft, USA). In Dbc, the image of the skeletonized vascular network is covered by a set of boxes, whose sides have a certain length. Boxes that have at least one point on the vascular network image are counted. The procedure is repeated several times with a larger number of boxes as the sides of the boxes decrease in size. Dbc is calculated by the inverted sign of the slope of the double log graph of the number of boxes containing the vessels as a function of the sides of boxes.[10]
At Dinf, the skeletonized image is also covered by several sets of boxes with different sizes. However, the counting of the boxes is performed based on the probability of occupation of these boxes by the vascular network represented by the Kolmogorov entropy. The procedure is repeated several times with a larger number of boxes as the sides of the boxes decrease in size. Finally, the Dinf is obtained by the slope of the double logarithm graph of Kolmogorov entropy by sides of boxes, with inverted sign.[10]
NOB
To assess vascular branching, bifurcations (regions where a larger blood vessel gives rise to smaller vessels) of the entire retinal vascular network and the macular region were identified and counted.
Statistical analysis
The Shapiro-Wilk test was used to assess the normality of Dcc, Dinf, and NOB values for each group. Student’s t-test was used to evaluate groups whose fractal and NOB values followed a normal distribution by the Shapiro-Wilk test. The Mann-Whitney test was used to assess groups whose data did not follow a normal distribution. A significant difference was established at P < 0.05. The groups calculated by the student’s t-test were represented by mean with standard deviation. While the groups calculated by the Mann-Whitney test were represented by median with interquartile deviation.
RESULTS
Figure 2 shows the median with interquartile deviation of the Dbc values of the entire retinal vascular network of the grade 2 DR groups without (1.27 ± 0.015) and with risk of DME (1.27 ± 0.012), as well as grade 3 DR groups without (1.24 ± 0.05) and with risk of DME (1.25 ± 0.025). Analysis of the entire retina using Dbc values showed no statistically significant difference between grade 2 DR groups without and with risk of DME (P = 0.53). There was also no statistical difference between the grade 3 DR groups without and with risk of DME (P = 0.92).
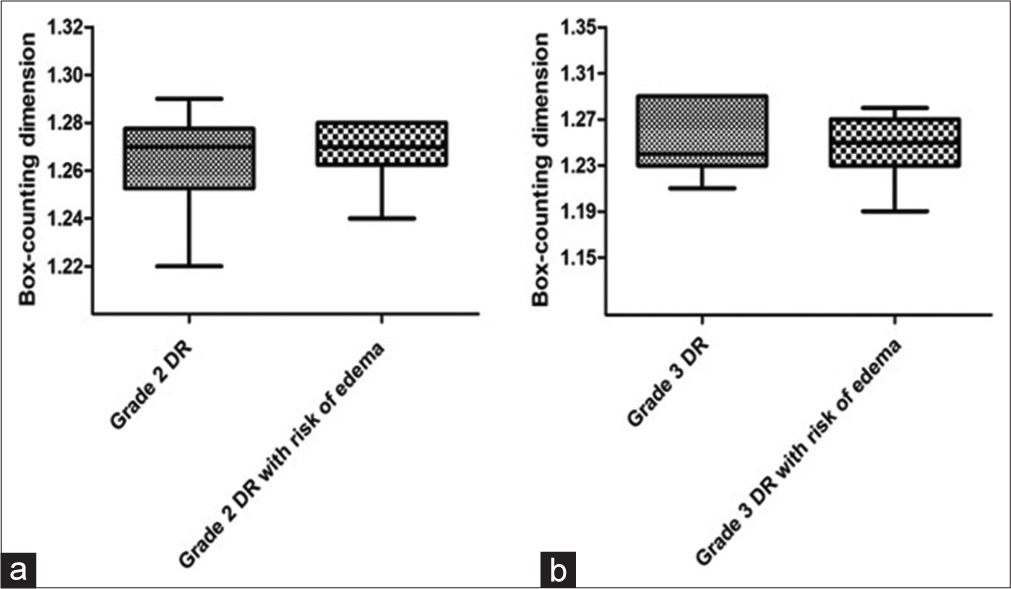
- Graph a presents the medians with interquartile deviations of the box-counting dimension (Dbc) values for the entire retina of grade 2 diabetic retinopathy (DR) groups without and with the risk of diabetic macular edema (DME). Graph b presents the medians with interquartile deviations of the Dbc values for the entire retina of grade 3 DR groups without and with risk of DME.
In Figure 3, there was no significant difference (P = 0.66) between the Dinf values of the vascular networks of the entire retina of the grade 2 DR groups without (1.32 ± 0.02) and with risk of DME (1.33 ± 0.012). There was also no significant difference (P = 0.23) when comparing the Dinf values of the vascular networks of the entire retina of the grade 3 DR groups without (1.31 ± 0.04) and with risk of DME (1.3 ± 0.02). The data in Figures 2 and 3 did not follow a normal distribution, except for graph B, whose data were treated using the student’s t-test, even though it was represented by medians with interquartile deviations.
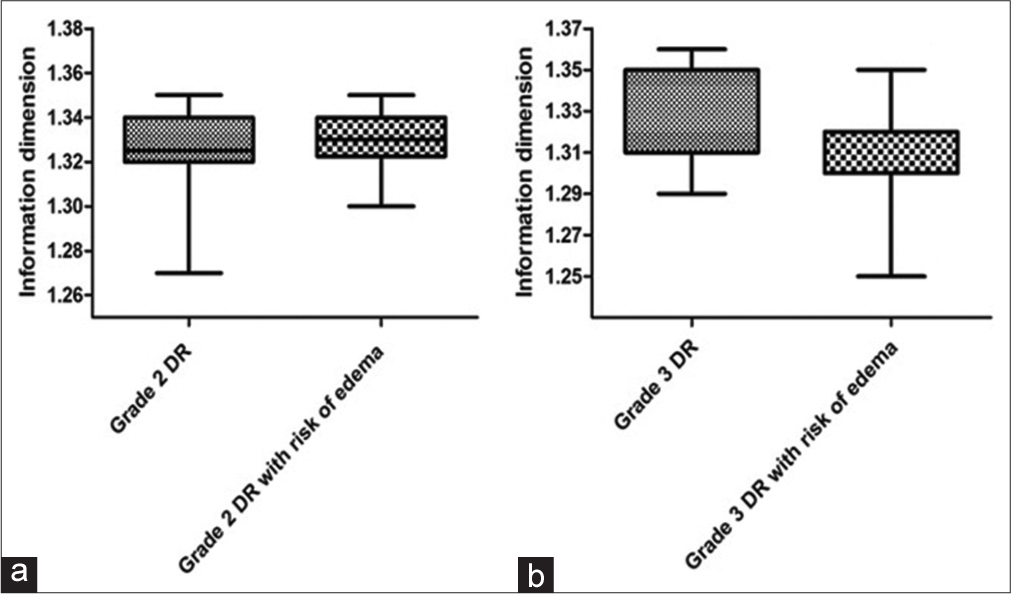
- Graph a presents the medians with interquartile deviations of information dimension (Dinf) values for the entire retina of grade 2 diabetic retinopathy (DR) groups without and with risk of diabetic macular edema (DME). Graph b presents the medians with interquartile deviations of Dinf values for the entire retina of grade 3 DR groups without and with risk of DME.
Figure 4 shows the averages with standard deviations of the Dbc values. The analysis of the Dbc values of the vascular networks in the macular region did not show a significant difference (P = 0.54) between the grade 2 DR groups without (1.044 ± 0.037) and with risk of DME (1.034 ± 0.04). There was also no significant difference (P = 0.53) between the grade 3 DR groups without (1.018 ± 0.039) and with risk of DME (1.005 ± 0.06).
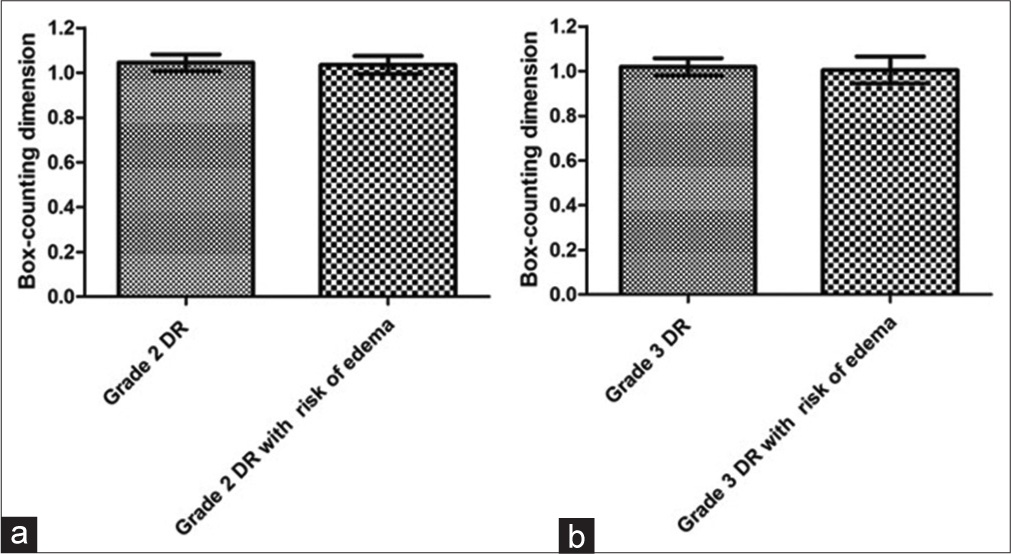
- Graph a shows the means with standard deviations of box-counting dimension (Dbc) values for the macular region of grade 2 diabetic retinopathy (DR) groups without and with risk of diabetic macular edema (DME). Graph b presents the means with standard deviations of Dbc values for the macular region of grade 3 DR groups without and with risk of DME.
Figure 5 shows the means with standard deviations of the Dinf values in the macular region between the grade 2 DR groups without and (1.09 ± 0.041) with risk of DME (1.08 ± 0.036), with no significant difference between them (P = 0.79). It can also be seen that there was no significant difference (P = 0.9) between the grade 3 DR groups without (1.056 ± 0.039) and with risk of DME (1.053 ± 0.065) for the macular region.
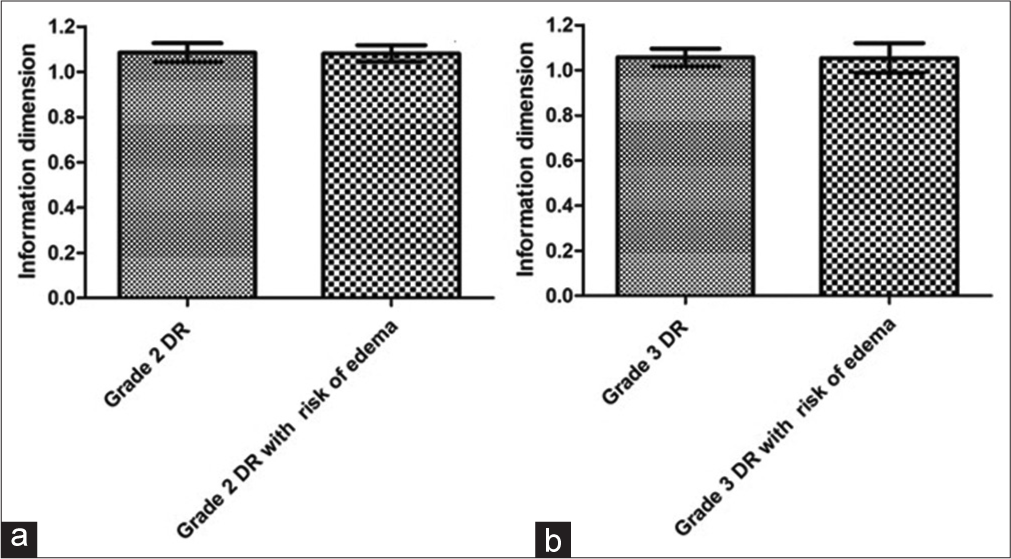
- Graph a shows the means with standard deviations of the information dimension (Dinf) values for the macular region of grade 2 diabetic retinopathy (DR) groups without and with risk of diabetic macular edema (DME). Graph b shows the means with standard deviations of Dinf values for the macular region of grade 3 DR groups without and with risk of DME.
Figure 6 shows the means with standard deviations of the NOB for the entire retina between the grade 2 DR groups without (82 ± 23.6) and with risk of DME (68.58 ± 7.58), with no significant difference between them (P = 0.07). In the same figure, the comparison between the grade 3 DR groups without (74.73 ± 25.93) and with risk of DME (72.82 ± 11.92) showed no significant difference (P = 0.82) for the entire retina.
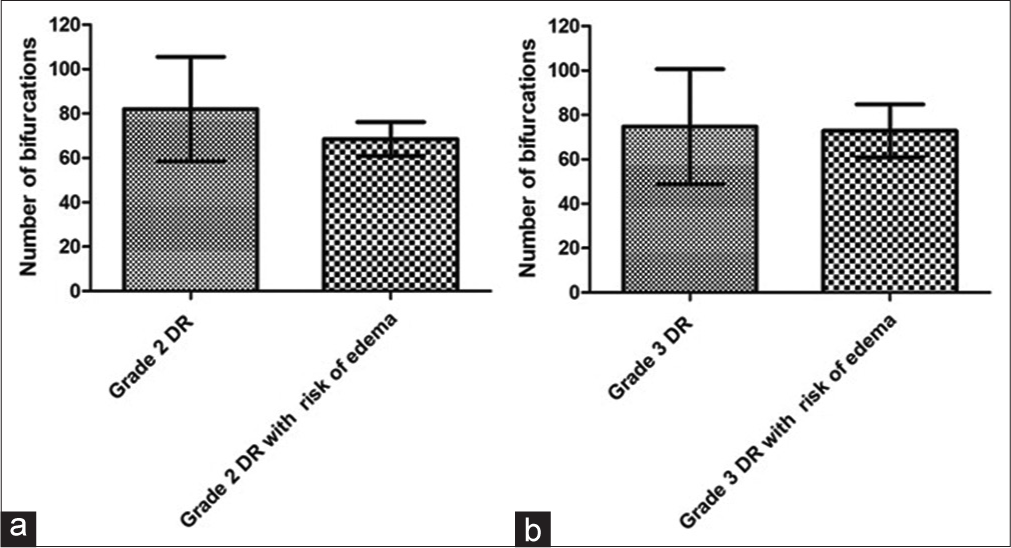
- Graph a shows the means with standard deviations of the number of bifurcations (NOB) of the entire retina of grade 2 diabetic retinopathy (DR) groups without and with the risk of diabetic macular edema (DME). Graph b presents the means with standard deviations from the NOB of grade 3 RD groups without and with risk of DME for the entire retina.
Figure 7 shows the means with standard deviations of the NOB of the macular region of the retina for the RD groups. There was no significant difference (P = 0.23) between the grade 2 DR groups without (9.58 ± 4.7) and with risk of DME (7.58 ± 3.12) groups. We can also observe that there was no significant difference (P = 0.81) between the groups grade 3 DR groups without (8.18 ± 4.58) and with risk of DME (7.73 ± 4.29) for the macular region.
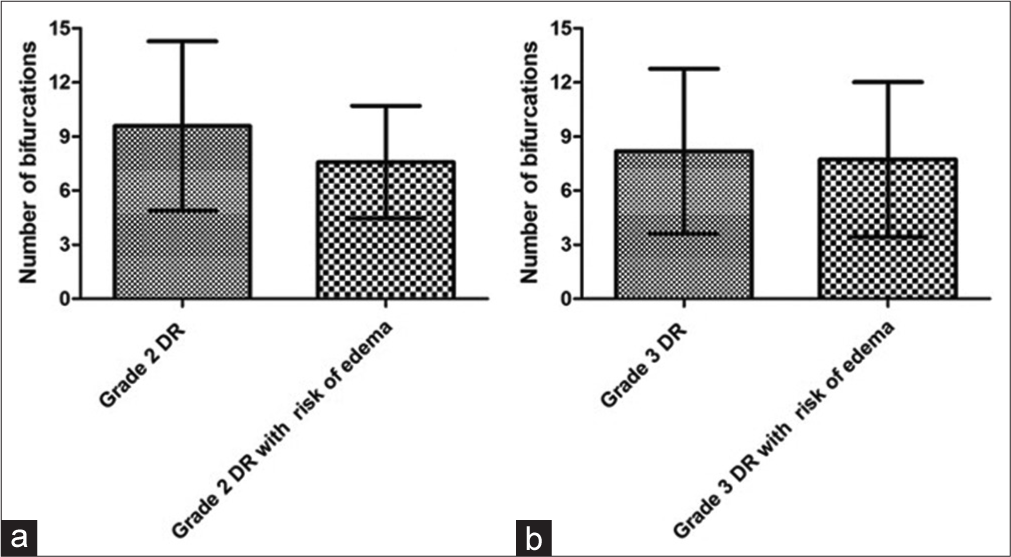
- Graph a presents the means with standard deviations of the number of bifurcations (NOB) in the retinal macular region of grade 2 diabetic retinopathy (DR) groups without and with risk of diabetic macular edema (DME). Graph b shows the means with standard deviations from the NOB of grade 3 RD groups without and with risk of DME for the macular region.
DISCUSSION
DM is one of the diseases that can generate serious structural and functional problems in the retina, giving rise to DR which can cause damage to vision,[4,15,16] such as loss of ganglion cells, horizontal cells, amacrine cells, and photoreceptors.[17]
DME is one of the complications of PDR,[4] characterized by the thickening of the macula, resulting from the intraretinal accumulation of fluid in the macula triggered by the breakdown of the blood-retinal barrier.[3] Although DR and DME are characterized by neurovascular damage to the retina, the architecture of the blood vessel network could be altered in relation to the risk of DME. Therefore, the organization of the retinal blood vascular network affected by DR could express the existence of a threshold for the risk of DME. Thus, nonlinear mathematical methods could help to quantify the geometry of the vascular network.
The follow-up of subjects with DM is necessary and tools such as fractal geometry could help in the parameterization of the DR, assisting in monitoring of the stages of the DR and risk of DME. Thus, our study tried to find, using two methods of FD and NOB, a difference between the architecture of the retinal vascular network in individuals with DR at risk and not for DME.
The fractal geometry was proposed to evaluate branching patterns in structures of complex shapes in nature that possess self-similarity; therefore, FD is an interesting geometric resource since it can be employed to study bifurcating structures such as the bronchial tree, the network of nerves and blood vessels.[7] Thus, methods to obtain the FD have been used to quantify the blood vessels network in the human retina, showing that this structure is a fractal object.[7]
FD has been used in studies of retinopathies or diseases that may be associated with changes in retinal blood vascularization. Doubal et al.[12] verified in subjects with lacunar stroke that the reduction of FD of retinal vessels is associated with the subtype of lacunar stroke and increasing age. While Cavallari et al.[13] observed a reduction in the FD of the retinal vascularization in individuals with cerebral autosomal dominant arteriopathy with subcortical infarcts and leukoencephalopathy.
In the RD study, Cheung et al.[11] found an association between increased FD of the retinal vascular network and early DR in young individuals with type 1 diabetes, suggesting that FD can ensure a quantitative assessment of microvascular damage. Orlando et al.[18] showed that FD increases with PDR level. Nevertheless, through a meta-analysis, Yu and Lakshminarayanan[14] concluded that the FD reduction is stronger in DR.
The FD could be a promising tool in the parameterization of the retinal vascular network, with this it could be applied in the ophthalmological clinic, helping in the diagnostic process. Nevertheless, in our results, FD and NOB of the vasculature of the entire retina and the macular region have not shown statistical differences between grade 2 DR groups without and with risk of DME, also between grade 3 DR groups without and with risk of DME. The difference between grade 2 and 3 DR groups is the frequency of microaneurysms and hemorrhages, in addition to the presence or absence of angiogenesis in group 3. Microaneurysms and hemorrhages are changes in the structure of the vascular network, with an effect on the endothelial wall of the vessels. Therefore, the presence of these changes could not generate a notable alteration in the entire morphology of the vascular network.
Differently of the presence of microaneurysms and hemorrhage, the angiogenesis may have a stronger influence on the architecture of the blood vascular network, since it is related to the increase in vascular density and branching, therefore directly affecting the increase in FD.[9] FD describes how much space is filled, and then the greater the complexity of how the object fills space, the greater its FD.[19]
According to our data, the risk of edema does not seem to promote a noticeable change in the architecture of the retinal vascular network, even though there is an indication of the breakdown of the blood-retinal barrier due to the presence of hard exudate close to the macular region. This shows that edema can arise regardless of the increased complexity of the vascular network, despite the fact that patients are at risk for DME when they are in grade 2 DR condition.
Although this study involved two different methods for obtaining the FD (Dbc and Dinf), in addition to NOB counting, other studies using other fractal methods could help to elucidate the results of this study. A study incorporating fractal methods, such as the radius mass dimension and correlation,[7] in addition to the lacunarity method,[10] could enrich the evaluation of the architecture of the retinal vascular network under the risk of DME. However, an overriding fact would be that the fundus images do not accurately reveal the smallest vessels and capillaries, as angiogenesis occurs at the level of the smallest vessels, fractal methods become incapable of efficiently evaluating this event.[9] We can also consider that when working with fluorescein angiography instead of normal retinographies, there is a greater color contrast of the vessels in relation to the fundus of the eye, so this can improve the quality of the image segmentation of the vessels, which can improve the fractal evaluation.
CONCLUSION
We can conclude, through the FD and the NOB, that the architecture of the retinal vascular network of individuals with diabetic retinopathy remains unchanged in the presence or absence of risk of macular edema.
Declaration of patient consent
Patient’s consent was not required as there are no patients in this study.
Conflicts of interest
There are no conflicts of interest.
Use of artificial intelligence (AI)-assisted technology for manuscript preparation
The authors confirm that there was no use of artificial intelligence (AI)-assisted technology for assisting in the writing or editing of the manuscript and no images were manipulated using AI.
Financial support and sponsorship
The authors thank the Coordination for the Improvement of Higher Education Personnel (CAPES), Foundation for Science and Technology Support in Pernambuco (FACEPE) and the National Council for Scientific and Technological Development (CNPq).
References
- Selective loss of inner retinal layer thickness in Type 1 diabetic patients with minimal diabetic retinopathy. Invest Ophthalmol Vis Sci. 2009;50:3404-9.
- [CrossRef] [PubMed] [Google Scholar]
- Detection and classification of retinal lesions for grading of diabetic retinopathy. Comput Biol Med. 2014;45:161-71.
- [CrossRef] [PubMed] [Google Scholar]
- Diabetic retinopathy: Pathophysiology and treatments. Int J Mol Sci. 2018;19:1816.
- [CrossRef] [PubMed] [Google Scholar]
- Classification of diabetic retinopathy and diabetic macular edema. World J Diabetes. 2013;4:290-4.
- [CrossRef] [PubMed] [Google Scholar]
- Epidemiology of diabetic retinopathy, diabetic macular edema and related vision loss. Eye Vis (Lond). 2015;2:17.
- [CrossRef] [PubMed] [Google Scholar]
- Fractal pattern formation in human retinal vessels. Physica D. 1989;38:98-103.
- [CrossRef] [Google Scholar]
- Fractal evaluation in retinographies of individuals with different grades of diabetic retinopathy. Rev Bras Oftalmol. 2022;8:e0060.
- [CrossRef] [Google Scholar]
- Fractal, multifractal and lacunarity analysis applied in retinal regions of diabetic patients with and without nonproliferative diabetic retinopathy. Fractal Geom Nonlinear Anal Med Biol. 2015;1:112-9.
- [CrossRef] [Google Scholar]
- Quantitative assessment of early diabetic retinopathy using fractal analysis. Diabetes Care. 2009;32:106-10.
- [CrossRef] [PubMed] [Google Scholar]
- Fractal analysis of retinal vessels suggests that a distinct vasculopathy causes lacunar stroke. Neurology. 2010;74:1102-7.
- [CrossRef] [PubMed] [Google Scholar]
- Fractal analysis reveals reduced complexity of retinal vessels in CADASIL. PLoS One. 2011;6:e19150.
- [CrossRef] [PubMed] [Google Scholar]
- Fractal dimension and retinal pathology: A meta-analysis. Appl Sci. 2021;11:2376.
- [CrossRef] [Google Scholar]
- Early cellular and molecular changes induced by diabetes in the retina. Diabetologia. 2001;44:791-804.
- [CrossRef] [PubMed] [Google Scholar]
- Retinal layers changes in human preclinical and early clinical diabetic retinopathy support early retinal neuronal and Müller cells alterations. J Diabetes Res. 2013;2013:905058.
- [CrossRef] [PubMed] [Google Scholar]
- Retinal ganglion cells in diabetes. J Physiol. 2008;586:4401-8.
- [CrossRef] [PubMed] [Google Scholar]
- Proliferative diabetic retinopathy characterization based on fractal features: Evaluation on a publicly available dataset. Med Phys. 2017;44:6425-34.
- [CrossRef] [PubMed] [Google Scholar]
- Fractal analysis of the vascular tree in the human retina. Annu Rev Biomed Eng. 2004;6:427-52.
- [CrossRef] [PubMed] [Google Scholar]


